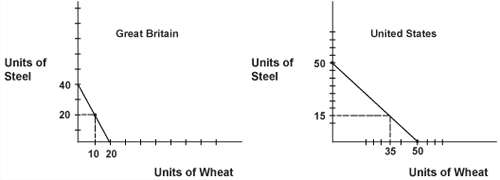
To illustrate the benefits of trade, we should look at the production possibility curves for two nations, Great Britain and the U.S. The production possibility curve (or production possibility frontier) shows the maximum possible output of an economy. To simplify things, we will assume that only two goods are produced - wheat and steel.
Figure 5.1: Production Possibility Curves
According to the production possibilities curve shown in the above graphs, the U.S. could produce 50 units of wheat per worker, if it devoted all of its resources to wheat production, and zero units of steel. If all resources were devoted to producing steel, then the U.S. would have 50 units of steel per worker and no wheat. If Great Britain devotes all of its resources to making wheat, it can produce 20 units of wheat, with no steel being produced. If that country concentrates all of its resources on producing steel, then 40 units of steel would be produced per worker, with no wheat production. Please note that the U.S. has an absolute advantage over Great Britain with both products because the U.S. workers are more productive than those from Great Britain. However, this is not important from an international trade perspective.
The domestic exchange rate within the U.S. for the two goods is 1:1; for each unit of steel produced, the U.S. must give up producing one unit of wheat. We could say that the cost of one unit of steel within the U.S., assuming no international trade, would be one unit of wheat. Similarly, the cost of one unit of wheat would be the loss of one unit of steel.
Great Britain would have a different domestic exchange rate. Its production possibility curve implies that the cost of one unit of steel would be one-half of a unit of wheat. The cost of one unit of wheat would be two units of steel. These costs can be obtained by looking at the slope of the production possibility curve.
If the U.S. and Great Britain both operated as autarkies (self-sufficient nations that do not trade), then each country would operate somewhere on their production possibilities curve. The exact point of production would depend on each country's supply and demand for the goods. For example, these points could be 35 units of wheat and 15 units of steel for the U.S., and 10 units of wheat and 20 units of steel for Great Britain, as illustrated in Figure 5.1.
About the Author
Posted by Muhammad Atif Saeed
on 19:11. Filed under
Economics,
Global Economics
.
You can follow any responses to this entry through the RSS 2.0.
Feel free to leave a response
By Muhammad Atif Saeed
on 19:11. Filed under
Economics
,
Global Economics
.
Follow any responses to the RSS 2.0. Leave a response


