Published On:Wednesday, 28 December 2011
Posted by Muhammad Atif Saeed
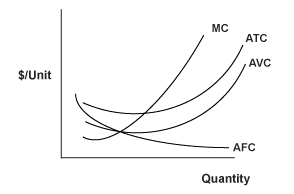
Marginal and Average Total Cost Curves
Cost Curves
The short-run marginal cost (MC) curve will at first decline and then will go up at some point, and will intersect the average total cost and average variable cost curves at their minimum points.
The average variable cost (AVC) curve will go down (but will not be as steep as the marginal cost), and then go up. This will not go up as fast as the marginal cost curve.
The average fixed cost (AFC) curve will decline as additional units are produced, and continue to decline.
The average total cost (ATC) curve initially will decline as fixed costs are spread over a larger number of units, but will go up as marginal costs increase due to the law of diminishing returns.
The graph below illustrates the shapes of these curves.
Figure 3.8: Cost Curves
 |
Diminishing Returns and Diminishing Marginal Product of Capital
The law of diminishing returns states that as one type of production input is added, with all other types of input remaining the same, at some point production will increase at a diminishing rate.
There may be levels of input where increasing inputs causes production to go up at an increasing rate. However, according to the law of diminishing returns, at some point production will go up at a decreasing rate.
The marginal product of capital is the increase in total output associated with an increase in capital, while holding the quantity of labor constant. Capital is also subject to the law of diminishing returns.
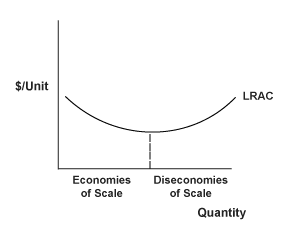
Economies of Scale
Economies of scale mean that goods can be produced at a lower cost per good, as the quantity produced increases. Large-scale factory operations can permit the most efficient specialization of machinery and labor. Average fixed costs will decline as costs such as advertising can be spread across more and more units.
Diseconomies of Scale
Diseconomies of scale occur when per unit costs go up as output is increased. A typical reason given is bureaucratic inefficiencies - more attention may be given to administrative rules as opposed to innovation. Worker motivation is also more difficult as the number of employees increases.
When economies of scale occur, the long-run average total cost (LRAC) curve will be declining; with diseconomies of scale, the LRAC curve will be rising.
Figure 3.9: Long Run Average Total Curve
 |